Performance is not only a matter of a fast backend. We have that for a long time. Our backend responds to 90% of the requests within 80ms, which is faster than a blink of an eye. Our databases and application servers are over-provisioned to handle at least 6 times our current load.
The biggest problem is delivering your requested content (be it the content of your subscriptions tree in the web version or the article contents in our iOS or Android app) to you over the wire. It’s a big problem because not all networks have fast access to our servers. So the the biggest impact on performance here comes from network transfers. In the past weeks we were slowly working on some changes (some big and some smaller) in our infrastructure to fight this problem.
Today we have deployed those changes in production and our end-to-end monitoring reports improvements by about 3 (three) times for some countries!
This change was deployed to all our web services, as well as our mobile apps.
You should already feel the difference, but anyway, let’s see some comparison charts, because who doesn’t like graphs? 🙂
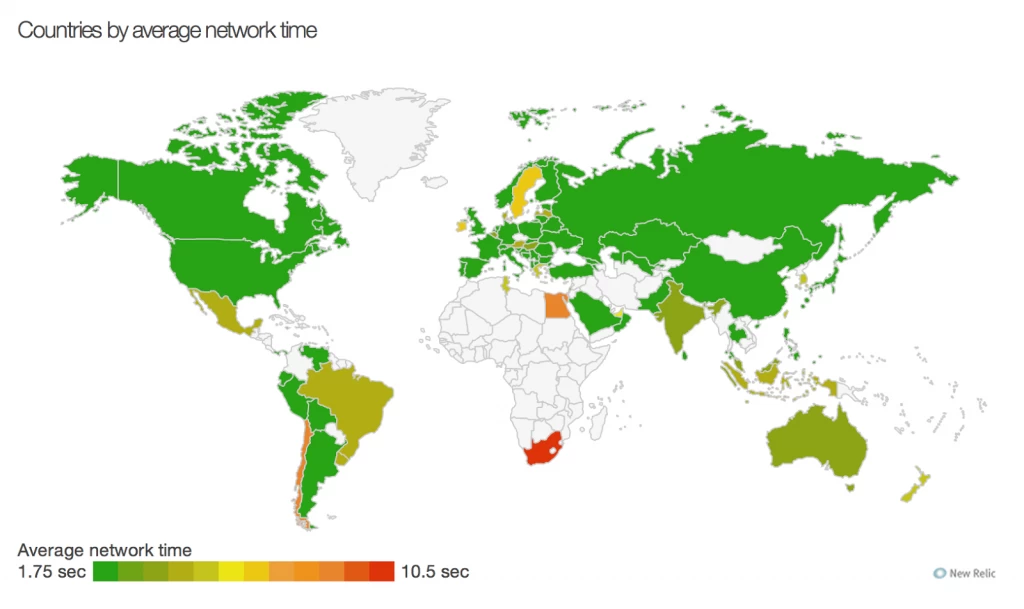
This map is from yesterday. You can see that overall latency is not huge, but there are countries, which lag behind.
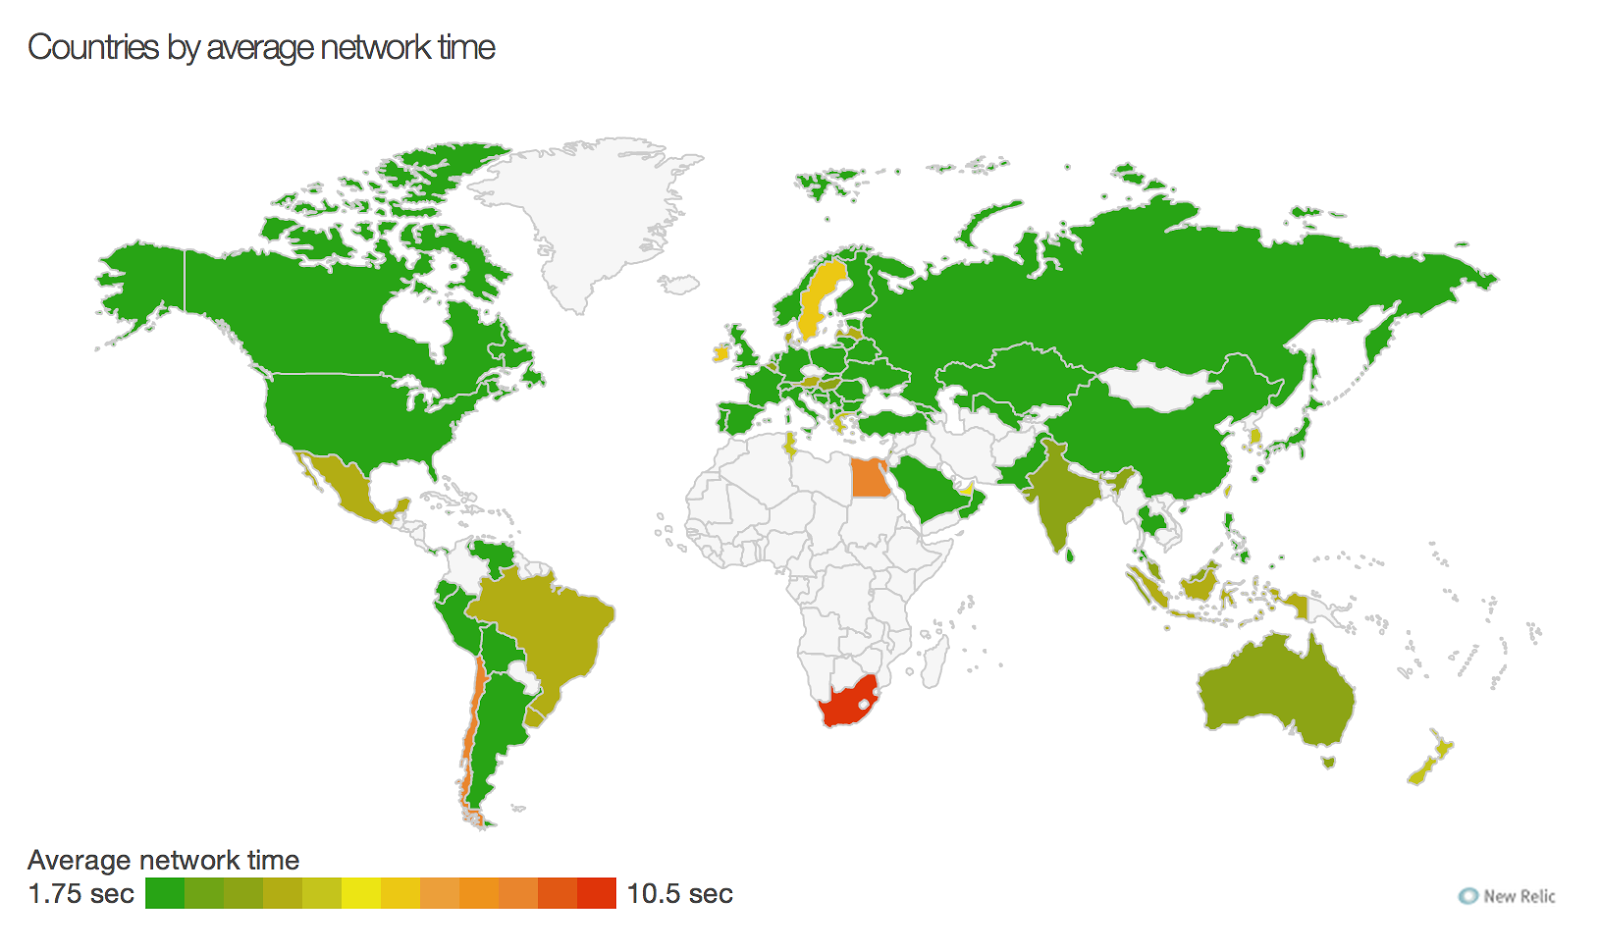 |
| Aug 21 2014 |
Here is the map from the same period from today:
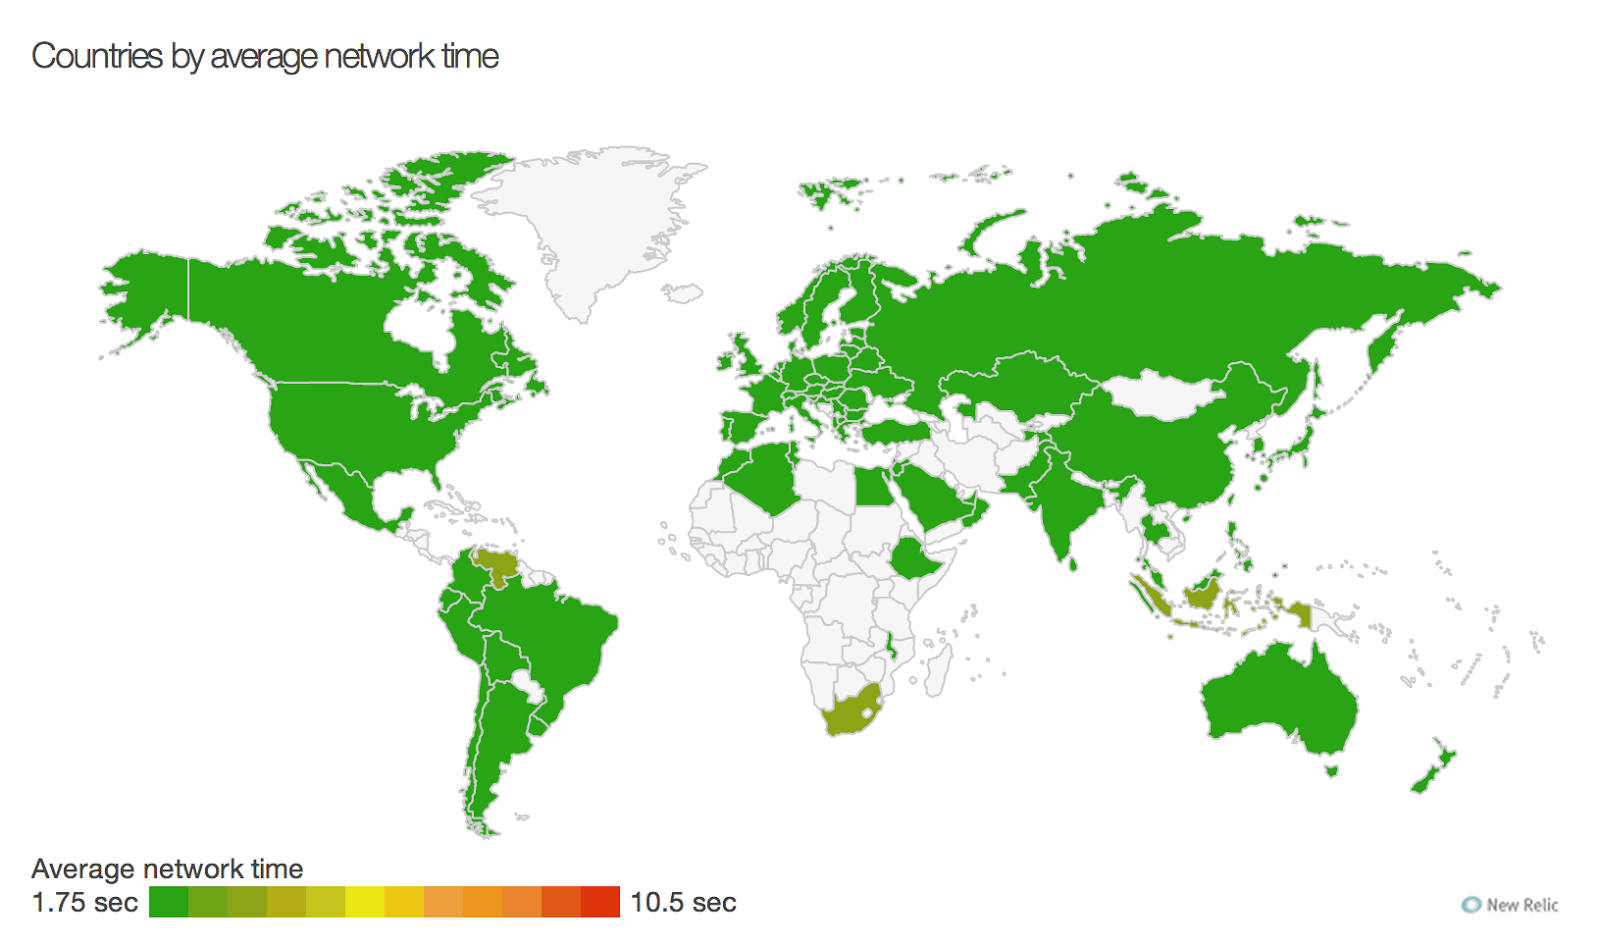 |
| Aug 22 2014 |
Almost everything is now green, falling below the 2 seconds threshold.
If the above pictures doesn’t give you a clear idea, here are two more, showing the comparison between yesterday’s and today’s
Apdex of
Inoreader:
Yesterday:
 |
| Aug 21 2014 |
Today:
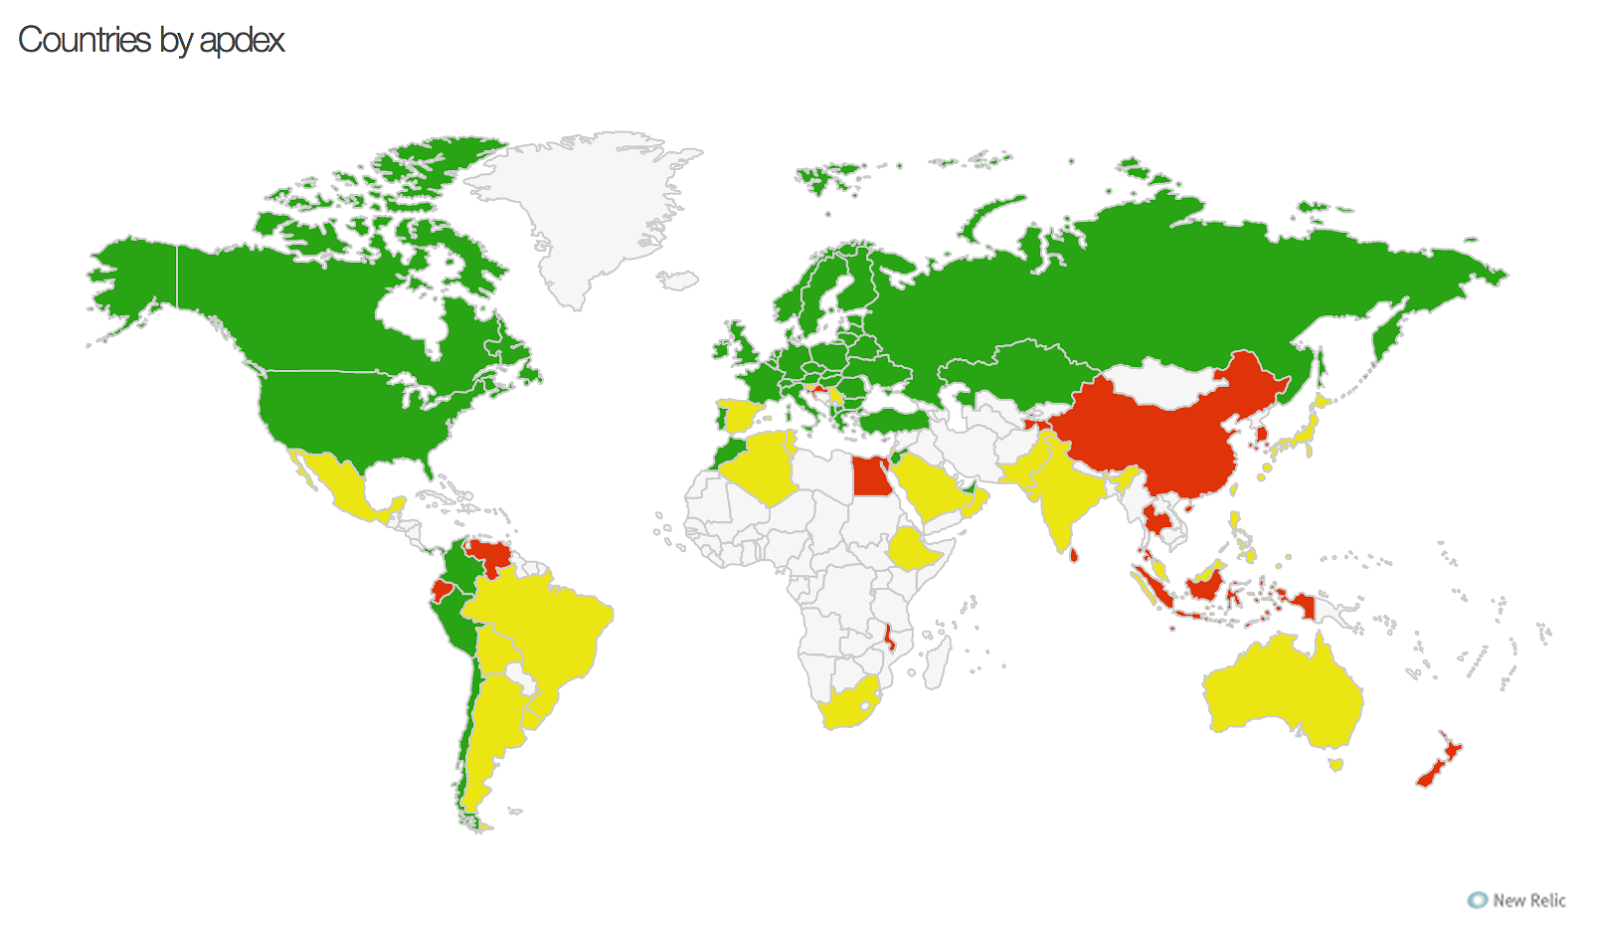 |
| Aug 22 2014 |
You should clearly see the difference now. Yes, there are still some red areas, but we can hardly do anything there at this point. We have some action points for the future, but still today’s update should be a huge improvement in many countries.
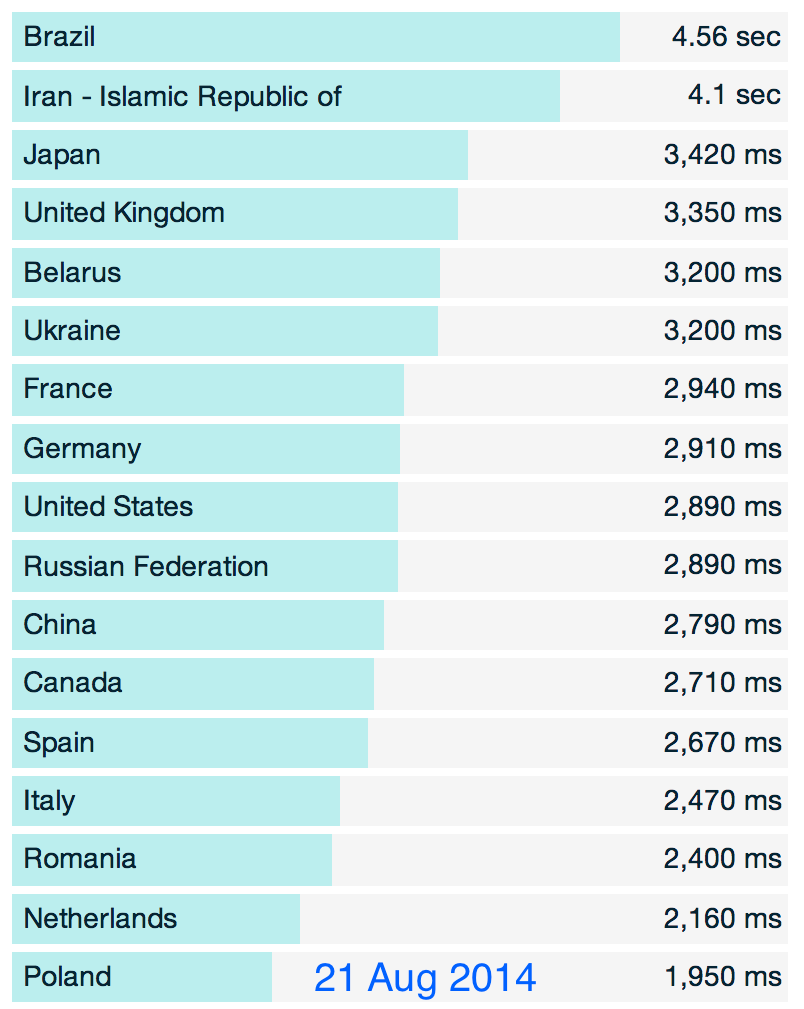
Finally here’s a breakdown of the worst performing countries (sorted by round-trip times in milliseconds) again from yesterday and today:
We hope you enjoy using Inoreader as much as we enjoy working on it!
—
The Innologica team
